Linux File System Troubleshooting Guide
Linux Storage Stack
The Linux storage stack is generally divided into three layers: File System Layer, Block Layer, and Device Layer.
The following diagram shows the structure of the storage stack, with different colors representing each component:
- Sky Blue: Hardware storage devices (including mmc, SD cards, USB drives, SSDs, and SATA hard disks used on the K1 platform.)
- Orange: Transport protocol layer
- Blue: Device files in the Linux system
- Physical hardware devices (e.g., sda for hard disks, mmc, nvme, etc.)
- Virtual block devices (e.g., loop, zram)
- Yellow: I/O scheduling policies (noop, deadline, CFQ)
- Green: Linux file systems
- Blue-Green: The basic data structure BIO for Linux Storage operations
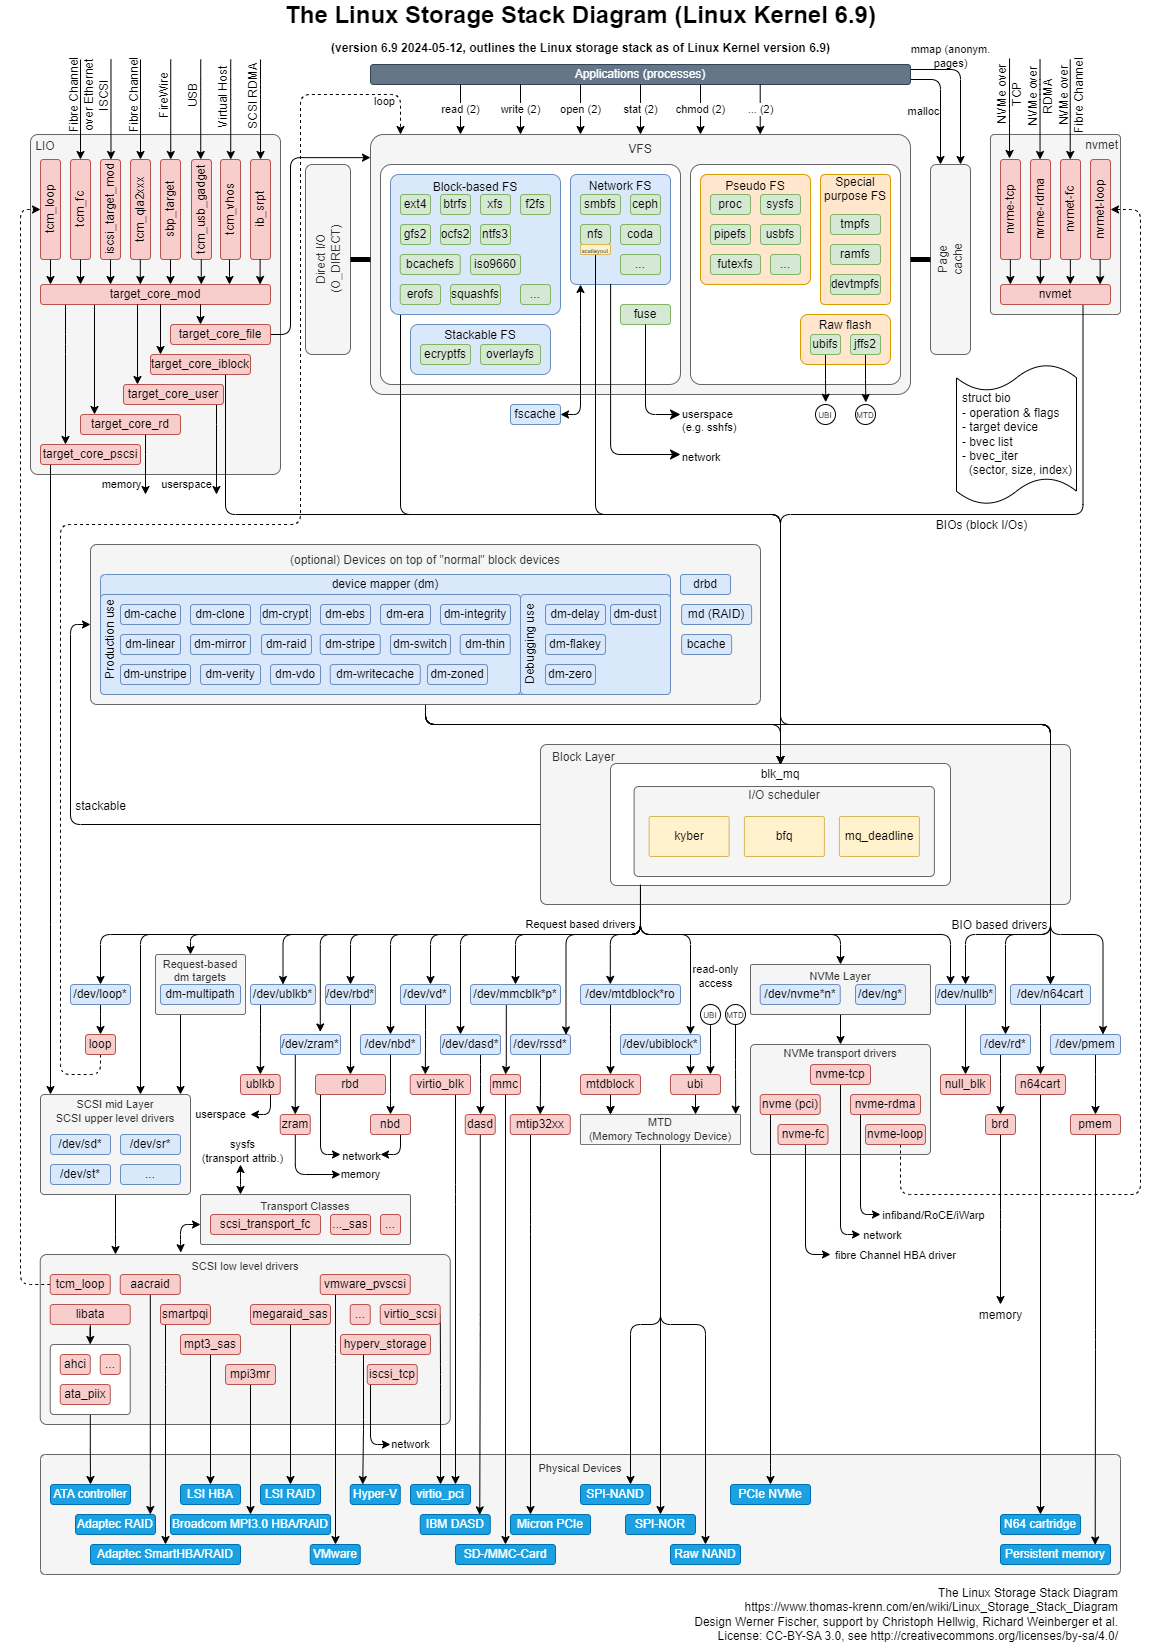
Image source: Thomas-Krenn AG
Original image link
Copyright notice: This image is used for technical illustration only. All rights belong to the original author.
Linux Write-Back Mechanism
Since hard disk read/write speeds are much slower than memory, the Linux kernel uses the Page Cache mechanism to store file data temporarily in memory. This helps reduce the need to access the disk directly for every file operation.
- Almost all file I/O operations rely on caching, unless the file is opened with the
O_DIRECTflag. - Caching greatly improves read/write performance, but it also introduces a risk of data loss during a power failure — calling
fwrite()orwrite()does not guarantee that data has been physically written to the storage device.
There are two types of data write-back mechanisms:
- Synchronous (manual) write-back
- Asynchronous (background) write-back
Synchronous (Manual) Write-Back
- Calling
writeonly submits data to the kernel’s Page Cache (assuming Direct I/O is not enabled). - To make sure the data is truly written to the storage device, you must call the
fdatasyncorfsyncsystem call. - Besides the Page Cache in kernel space, the C library layer also has its own buffer. You should first call
fflushto write data from the C library buffer into the kernel Page Cache, and then callfsyncto flush it to the physical device.
Comparison of system sync interfaces
| Interface | Scope and granularity |
|---|---|
fflush | Flushes data from the C library buffer to the kernel Page Cache |
fdatasync | Ensures data of a single file is written back for better performance; file metadata (e.g., modification time) is not guaranteed to be written |
fsync | Ensures both file data and metadata are written from the kernel cache to disk |
sync | Queues all dirty pages in the system for writing; returns immediately after the operation is scheduled |
Asynchronous (Background) Write-Back
The Linux kernel periodically triggers asynchronous write-back threads to flush dirty pages in the background. The process works as follows:
Step 1: The kernel wakes up the write-back thread at intervals defined by dirty_writeback_centisecs.
Step 2: The write-back thread scans the Page Cache to find pages that have been dirty for longer than the value specified in dirty_expire_centisecs, and writes them back to the storage device.
Step 3: The thread then checks whether the total amount of dirty data exceeds the thresholds set by dirty_background_ratio (percentage of total memory) or dirty_background_bytes (absolute size). If either limit is exceeded, it initiates write-back for all dirty pages.
Step 4: After completing the operation, the thread waits for the next scheduled wake-up cycle.
Relevant Configuration Parameters
| Parameter | Description | Default |
|---|---|---|
dirty_background_ratio | Percentage of system memory that can be filled with dirty pages before the background write-back thread is triggered. | 10 |
dirty_background_bytes | Absolute limit of dirty data (in bytes) before the background write-back thread is triggered. | 0 |
dirty_ratio | Maximum percentage of dirty data allowed before user processes that generate writes are paused. | 20 |
dirty_bytes | Absolute limit of dirty data (in bytes) before user processes that generate writes are paused. | 0 |
dirty_expire_centisecs | Time threshold after which dirty pages are considered old enough to be written back (unit: 1/100 second). | 3000 |
dirty_writeback_centisecs | Time interval between periodic wake-ups of the background write-back process (unit: 1/100 second). | 500 |
Linux Data Readahead
Readahead in Linux can be classified into synchronous readahead and asynchronous readahead.
By default, whether the call is made from user space (read) or kernel space (vfs_read), the Linux kernel performs readahead — meaning that part of the data is preloaded into the Page Cache before it is actually requested.
-
Sequential Read Acceleration: When sequential access is detected, the kernel gradually expands the readahead window (
ra->size), allowing more data to be read in advance. A typical example is reading a log file sequentially. -
Random Read Suppression: When the kernel detects a non-sequential access pattern, it automatically shrinks the readahead window to avoid unnecessary reads.
Check the default readahead size (unit: 512-byte sectors) with the following command:
cat /sys/block/sda/queue/read_ahead_kb
Programming-Level Optimization
- Use
posix_fadvise()to explicitly declare the access pattern. - For sequential file access, set the
POSIX_FADV_SEQUENTIALflag.
Performance Testing
Fio
Source Code
Source code: https://github.com/axboe/fio
You can download and compile the source code manually, or install the tool directly from your operating system’s package manager.
bian-linux includes fio by default.
Common Parameters
- time
- runtime=time
  Tells `fio` to terminate processing after the specified time period.
  If the time unit is omitted, the value is interpreted in **seconds**.
  You can also specify it directly, e.g. `runtime=24h`.
  This is generally used for **read/write aging scenarios**.

- time_based
  When set, even if the file is fully read or written, `fio` will continue to run for the specified runtime.
  It will loop over the same workload multiple times within the permitted `runtime` period.
  This is also commonly used for **read/write aging scenarios**.
- I/O type
- direct=bool
  Whether to use Direct I/O.
  When enabled, the OS’s buffer is bypassed, producing more realistic test results.

- rw=randwrite
  Tests random write I/O.
  - Sequential I/O: read/write operations access addresses in consecutive order.
  - Random I/O: read/write operations occur consecutively in time but access addresses are scattered randomly across the disk.

- rw=randrw
  Tests a mix of random read and write I/O.

- rwmixwrite=int
  In mixed read/write mode, specifies the percentage of writes.
  Example: `rwmixwrite=30` means writes occupy 30% of the I/O.
- Blocks size
- bs=int
  The block size for a single I/O operation, e.g., `16k`.

- bsrange=1k-4k, 2k-8k, 1k-4k
  Specifies a range of block sizes.
  You can provide comma-separated ranges for read, write, and trim operations.

- size=5G
  The amount of data each thread reads or writes, e.g., `5GB`.
- Job description
- name=str
  The name of a job. Duplicates are allowed.
  For example, if you specify `fio -name=job1 -name=job2`, two jobs are created: `job2` inherits parameters defined after `-name=job2`, while `job1` keeps the parameters defined after `-name=job1` and before `-name=job2`.

- numjobs=int
  Specifies the number of clones for this job.
  Each clone runs as an independent thread or process (performing the same workload).
  Each job (`-name`) opens one thread by default, so total threads = number of jobs (`-name`) × `numjobs`.

- filename=str
  The name of the test file.
  It can be a relative or absolute path. If not specified, Fio will create the file automatically.
- I/O engine
- ioengine=<str>
  Specifies the I/O engine used by Fio. Options include:
  - `sync` – basic synchronous read/write operations, similar to `fsync` and `fdatasync`.
  - `psync` – I/O based on `pread(2)` or `pwrite(2)`.
  - `vsync` – variant of synchronous I/O (specific to Fio).
  - `pvsync` – variant of `psync`.
  - `pvsync2` – improved version of `pvsync`.
  - `io_uring` – fast Linux native asynchronous I/O, supporting both direct and buffered operations.
  - `io_uring_cmd` – fast Linux native async I/O for passing commands.
  - `libaio` – Linux asynchronous I/O. Note: Linux may only support queued operations with direct I/O.
- IO depth
- iodepth=int
  The depth of the I/O queue. In asynchronous mode, the CPU cannot continuously issue an unlimited number of commands to the SSD.
- Buffers and memory
- lockmem=int
  Use `mlock(2)` to lock a specified amount of memory.
  This can be used to simulate a smaller memory size, testing only with the specified memory.

- zero_buffers
  Initialize buffers with all zeros.
  Default: buffers are filled with random data. Usually, the default is sufficient.
- Command line options
- --output=filename
  Output log information to the specified file.

- --output-format=format
  Specify the output file format.
  Log format can be set to `normal`, `terse`, `json`, or `json+`.
  Multiple formats can be selected, separated by commas.
  - `terse` is a CSV-based format.
  - `json+` is similar to JSON but includes a full dump of latency buckets.
- Reports
- group_reporting
  Controls result display by aggregating information from each thread or process.
-
Vertify
Tip: It is generally recommended to enable this option during read/write aging tests.
verify=crc32c          # Use CRC32C for verification
verify_fatal=1         # Stop immediately if a verification error occurs
verify_dump=1          # Dump the erroneous data
verify_state_save=1    # Save verification state
do_verify=1            # Verify immediately after writing
Example Usage
Test read/write performance
Test write speed io:

fio --name=write_test --filename=/path/to/testfile --size=1G --bs=4k --rw=write --ioengine=libaio --direct=1 --numjobs=1 --runtime=60 --group_reporting

Test read speed io:

fio --name=read_test --filename=/path/to/testfile --size=1G --bs=4k --rw=read --ioengine=libaio --direct=1 --numjobs=1 --runtime=60 --group_reporting

Test read and write speed io:

fio --name=rw_test --filename=/path/to/testfile --size=1G --bs=4k --rw=randrw --rwmixread=70 --ioengine=libaio --direct=1 --numjobs=1 --runtime=60 --group_reporting
Test read/write aging with data verification
fio --name=randrw_test --filename=/dev/mmcblk2p6 --rw=randrw --rwmixread=70 -rwmixwrite=30 --bs=4k --size=1G --ioengine=libaio --direct=1 --numjobs=1 -runtime=24h -time_based --iodepth=32 --verify=crc32c --verify_fatal=1 --group_reporting
dd
Used for quickly testing sequential read/write performance
Example Usage
#  Sequential Write Performance Test
dd if=/dev/zero of=./testfile bs=1G count=1 oflag=direct

#  Sequential Read Performance Test
dd if=/dev/zero of=./testfile bs=1G count=1 oflag=direct
Before testing read performance, make sure the test file is not in the memory cache. Clear the cache before measuring sequential read performance.
Example command:
sudo sh -c 'sync && echo 3 > /proc/sys/vm/drop_caches'
Random Testing
The dd command’s random testing is usually performed with bs=4k to simulate small-block read/write operations in real-world scenarios.
Performance Analysis Tools
Common Application-Level Tools
iostat
Purpose: Real-time monitoring of I/O load, latency, and utilization
Applicable Scenarios: Used for basic monitoring of CPU usage and I/O performance to identify potential bottlenecks
Basic Syntax:
iostat [options] [interval] [count]
Common Parameters
| Parameter | Description |
|---|---|
-c | Display only CPU utilization report |
-d | Display only device (disk) utilization report |
-x | Show extended I/O statistics (highly recommended); provides detailed metrics such as await, svctm, util, etc. |
-k | Display data in KB/s (instead of default blocks/s) |
-m | Display data in MB/s |
-p | Show statistics for block devices and all their partitions. -p ALL shows all device partitions |
-t | Show timestamp in the output |
-y | Skip the first report (average statistics since system boot), display interval data directly |
-h | Human-readable format (automatically formats units) |
-z | Omit devices with no activity during sampling |
Usage Example
iostat -d -k -x 1 100
Linux 6.6.63 (k1)       2025.07.04  _riscv64_       (8 CPU)

Device            r/s     rkB/s   rrqm/s  %rrqm r_await rareq-sz     w/s     wkB/s   wrqm/s  %wrqm w_await wareq-sz     d/s     dkB/s   drqm/s  %drqm d_await dareq-sz     f/s f_await  aqu-sz  %util
mmcblk2          1.00     14.12     0.00   0.00    0.62    14.15    0.01      0.00     0.00   0.00    0.00     0.00    0.00      0.00     0.00   0.00    0.00     0.00    0.01    0.00    0.00   0.03
nvme0n1         38.22   1527.17    11.46  23.07    0.25    39.96    6.44     55.63     1.45  18.32    1.00     8.63    0.00      0.00     0.00   0.00    0.00     0.00    0.15    0.31    0.02   0.79
strace
Purpose: Trace all system calls made by a process, along with their parameters, return values, and execution time.
Use Case: Diagnosing unexpected program exits, performance slowdowns, or process hangs.
Common Options
Usage
strace -f -F -T -tt -o output.txt staced_cmd
| Option | Description |
|---|---|
-f | Trace child processes created by fork() |
-F | Trace child processes created by vfork() |
-tt | Prefix each line of output with a timestamp (microsecond precision) |
-T | Display the time spent in each system call |
-o | Write output to a specified file |
Example Usage
strace -T -tt -f -F ls
strace -T -tt -e trace=all -o output.txt -p xxx
Each line represents a single system call.
The left side of the equals sign shows the system call name and its arguments, while the right side shows the return value.
strace receives information directly from the kernel and does not require any special kernel configuration or modification.
lsof
lsof (List Open Files) is a tool used to display all open files on the system.
In Linux, almost everything — processes, sockets, devices — is represented as a file.
Common Parameters
| Column | Meaning |
|---|---|
COMMAND | Name of the process |
PID | Process ID |
PPID | Parent Process ID (requires -R option) |
USER | Process owner |
PGID | Process group ID |
FD | File descriptor used by the process to access the file |
TYPE | File type, e.g., DIR, REG, etc. |
DEVICE | Disk on where the file resides |
SIZE | File size |
NODE | Inode number |
NAME | Name of the opened file |
Example Usage
To view files opened by a process using lsof, use the following command:
# View files in a mounted filesystem (check filesystem locks)
lsof /boot

# Check which process is using a specific port
lsof -i :3306

# View files opened by a specific user
lsof -u username

# View files opened by a specific process
lsof -p 4838

# View remote network connections opened by a process
lsof -i @192.168.34.128
Kernel Performance Tools
Blktrace
Blktrace provides detailed timing information for the I/O subsystem, which is useful for identifying whether slow performance originates from I/O scheduling or hardware response.
Supporting tools:
blkparse: Reads raw logs generated by Blktrace and produces a readable summary of I/O operations.btt: Included in the Blktrace package, it analyzesblkparseoutput and displays the time consumed at each layer of the I/O stack, helping identify bottlenecks.
Kernel Configuration
CONFIG_FTRACE=y
CONFIG_BLK_DEV_IO_TRACE=y
Common Parameter
| Parameter | Description | Example |
|---|---|---|
-w <seconds> | Set the data collection duration | blktrace -d /dev/sda -w 10 |
-a <event> | Filter by event type (e.g., read, write) | blktrace -d /dev/sda -a read |
-o <prefix> | Specify a custom prefix for output files | blktrace -d /dev/sda -o mylog |
Example Usage
blktrace -d /dev/mmcblk2p6
blkparse -i mmcblk2p6 -d blkparse.out
btt -i blkparse.out
Sample Output:
ALL           MIN           AVG           MAX           N
Q2Q      0.000001140   0.000029558   0.012633253   33822
D2C      0.000118989   0.003573138   0.015725019   33823
Explanation:
- Q2Q: Queue-to-Queue latency — the delay between consecutive I/O requests
- D2C: Device-to-Completion latency — the physical delay from driver submission to I/O completion (device response time)
Key Output Fields
| Field | Meaning |
|---|---|
| Device | e.g., 8,0 (major device number + minor device number) |
| CPU ID | CPU core handling the I/O |
| Sequence # | Unique identifier for the I/O request |
| Timestamp | Event trigger time (seconds) |
| PID | Process ID initiating the I/O |
| Event Type | Core field: Q (I/O request queued), G (request enters generic block layer), I (inserted into I/O scheduler queue), D (submitted to device driver), C (I/O completed) |
| Operation | R (read), W (write), D (block operation) |
| Sector Info | Starting sector + number of sectors, e.g., 223490+56 |
Process Flow Explanation:
I/O request queued (Q) → enters block layer (G) → inserted into scheduler queue (I) → submitted to driver (D) → completed (C)
Bpftrace
Bpftrace is a high-level tracing language based on eBPF technology, designed for real-time diagnostics in Linux systems. Its core advantages include:
- Dynamic Probes: Supports hooking kernel/user-space functions without reboot
- Low Overhead: Ensures safe execution via the eBPF verifier
- C-like Syntax: Simplifies script development
- Multi-source Data Fusion: Can simultaneously capture system calls, performance events, and more
Main Use Cases
- System Performance Analysis
- CPU Usage Analysis: Trace process scheduling, context switches, CPU cache hits, etc.
- Memory Analysis: Monitor memory allocation/deallocation, page faults, memory leaks, etc.
- I/O Performance: Measure file read/write and disk I/O latency
- Network Performance: Analyze packet processing, socket operations, etc.
- Troubleshooting and Debugging
- System Call Tracing: Monitor system calls and their parameters for specific processes
- Function Call Tracing: Record call paths and parameters of specific functions
- Anomaly Detection: Identify abnormal system call patterns or error return values
Probe Types
| Type | Description | Example |
|---|---|---|
| kprobe | Hook at a kernel function entry | kprobe:vfs_read |
| uprobe | Hook at a user-space function | uprobe:/bin/bash:readline |
| tracepoint | Static tracepoint in the kernel | tracepoint:syscalls:sys_enter_openat |
| interval | Timer-based trigger | interval:s:5 (executes every 5 seconds) |
Kprobe
Configuration
CONFIG_KPROBES
CONFIG_HAVE_KPROBES
CONFIG_KPROBE_EVENTS
Example Usage
Get function offsets
bpftrace -e 'kprobe:do_sys_open+9 {printf("in here);}'
Measure sys_read() execution time
- Supports adding filters to record call context, such as process name and parameters
- This timing method in bpftrace is more precise than tools like ftrace, offering nanosecond-level resolution
#!/usr/bin/bpftrace

BEGIN {
    printf("Tracing sys_read execution time... Hit Ctrl-C to end.\n");
}

kprobe:sys_read
{
    @start[tid] = nsecs;
}

kretprobe:sys_read
/@start[tid]/
{
    $duration = nsecs - @start[tid];
    @times = hist($duration / 1000);  // 转换为微秒
    delete(@start[tid]);
}

END {
    printf("\nSys_read execution time distribution (us):\n");
    print(@times);
}
Uprobe
Configuration
CONFIG_UPROBE
ARCH_SUPPORT_UPROBES
CONFIG_UPROBE_EVENTS
Example Usage
Measure execution time for each program run
bpftrace -e 'BEGIN {@ts = nsecs} uprobe:./example:test {$lat=nsecs - @ts; printf("%s: duration at %d is %d\n", comm, arg0,
$lat); @ts=nsecs}'
Attaching 2 probes...
example: duration at 1 is 657420674
example: duration at 2 is 105863
example: duration at 3 is 16843
example: duration at 4 is 9517
example: duration at 5 is 8882
example: duration at 6 is 9386
example: duration at 7 is 10101
example: duration at 8 is 10086
example: duration at 9 is 10005
example: duration at 10 is 10003
example: duration at 1 is 1000382292
...
File Access Monitoring
# Trace file open operations (including process name and file name)
bpftrace -e 'tracepoint:syscalls:sys_enter_openat { printf("%s -> %s\n", comm, str(args.filename)); }
System Call Statistics
# Count system calls by process
bpftrace -e 'tracepoint:raw_syscalls:sys_enter { @[comm] = count(); }'
Measure vfs_read Call Latency Distribution
bpftrace -e 'kprobe:vfs_read { @start[tid] = nsecs; } kretprobe:vfs_read /@start[tid]/ { @ns[comm] = hist(nsecs - @start[tid]); delete(@start[tid]); }'
Attaching 2 probes...

[...]
@ns[snmp-pass]:
[0, 1]                 0 |                                                    |
[2, 4)                 0 |                                                    |
[4, 8)                 0 |                                                    |
[8, 16)                0 |                                                    |
[16, 32)               0 |                                                    |
[32, 64)               0 |                                                    |
[64, 128)              0 |                                                    |
[128, 256)             0 |                                                    |
[256, 512)            27 |@@@@@@@@@                                           |
[512, 1k)            125 |@@@@@@@@@@@@@@@@@@@@@@@@@@@@@@@@@@@@@@@@@@@@@       |
[1k, 2k)              22 |@@@@@@@                                             |
[2k, 4k)               1 |                                                    |
[4k, 8k)              10 |@@@                                                 |
[8k, 16k)              1 |                                                    |
[16k, 32k)             3 |@                                                   |
[32k, 64k)           144 |@@@@@@@@@@@@@@@@@@@@@@@@@@@@@@@@@@@@@@@@@@@@@@@@@@@@|
[64k, 128k)            7 |@@                                                  |
[128k, 256k)          28 |@@@@@@@@@@                                          |
[256k, 512k)           2 |                                                    |
[512k, 1M)             3 |@                                                   |
[1M, 2M)               1 |                                                    |
bpftrace vs strace
| Feature | bpftrace | strace |
|---|---|---|
| Tracing Level | Any function in kernel/user space | Only system call level |
| Performance Impact | Low overhead | Higher overhead |
| Functionality Scope | Custom complex tracing logic | Fixed system call tracing |
| Ease of Use | Requires scripting | Direct command-line usage |
Perf
Perf is a tool for software performance analysis.
-
Performance Statistics: Applications can leverage PMU, tracepoints, and special kernel counters for performance monitoring.
-
Analysis Capabilities:
- Identify performance issues of specific applications (per thread)
- Diagnose kernel performance problems
- Analyze application code and kernel together to understand performance bottlenecks
- Monitor hardware events during execution
- Track software events during execution, such as page faults, context switches, and cache misses
-
Other Features:
- Calculate IPC (instructions per cycle)
- Replace
stracefor system call tracing - Add dynamic kernel probes
- Benchmark and evaluate scheduler performance
Common Parameters
| Parameter | Description |
|---|---|
stat | Display brief performance statistics, including CPU cycles, instructions, cache hits, etc. |
perf list | List available performance events and counters |
record | Record performance events and generate data files for later analysis |
top | Show performance statistics of running processes and functions (similar to the top command) |
report | Analyze a data file and generate a performance report |
annotate | Link source code to performance analysis results for source-level analysis |
perf record -e <event> | Record specified performance events |
perf record -p <pid> | Record performance events for a specific process |
perf record -a | Record system-wide performance events |
perf report -n | Generate a performance report without requiring source code |
Example Usage
- Check Cache Hit Rate
This example allows you to quickly understand CPU cache usage and efficiency:
perf stat -e l1d_load_access,l1d_load_miss,l1i_load_access,l1i_load_miss,l2_load_miss,l2_load_access -p 3014 sleep 2
 Performance counter stats for process id '3014':
        50,436,940      l1d_load_access #6.42% of all L1-dcache accesses
         3,136,603      l1d_load_miss
       768,043,161      l1i_load_access
         5,217,676      l1i_load_miss
         5,227,730      l2_load_miss #44%
        11,883,914      l2_load_access
       2.006649641 seconds time elapsed
-
Display Real-Time System Performance Statistics
perf top- Used for real-time system performance monitoring, showing CPU time consumed by each specific function.
- By default, it collects execution data for both user-space programs and kernel functions across all CPUs.
- This command is mainly used to observe the current state of the system. By inspecting its output, you can quickly identify the most time-consuming kernel functions or user processes, which helps pinpoint performance bottlenecks.
perf top -e cpu-clock -
Display Summary Performance Statistics for a Program or Process
perf stat
Provides a concise summary of overall performance for the program being profiled, giving aggregated statistics and key metrics.perf stat -p 6421
Performance counter stats for process id '6421':
37,059.60 msec task-clock # 1.354 CPUs utilized
29,052 context-switches # 783.927 /sec
1,011 cpu-migrations # 27.280 /sec
141 page-faults # 3.805 /sec
58,635,997,124 cycles # 1.582 GHz
9,428,213,699 instructions # 0.16 insn per cycle
1,000,575,638 branches # 26.999 M/sec
74,397,683 branch-misses # 7.44% of all branches
27.378870476 seconds time elapsed -
Record Function-Level Performance Events
perf record- Records performance statistics at the function level. Use
perf reportto display the results.
Parameter explanation:
-F 99: Sample 99 times per second-a: Collect information from all CPUs
perf record -e cpu-clock

# Output When Stopping Collection
^C[ perf record: Woken up 72 times to write data ]
[ perf record: Captured and wrote 19.862 MB perf.data (349631 samples) ] - Records performance statistics at the function level. Use
-
Display Detailed Statistics
perf report- After running
perf record, aperf.datafile will be generated in the current directory. - Using
perf reportreads theperf.datafile and displays detailed statistics in the terminal.
- After running
Samples: 349K of event 'cpu-clock', Event count (approx.): 87407750000
Overhead  Command          Shared Object                    Symbol
  14.34%  swapper          [kernel.kallsyms]                [k] default_idle_cal
   3.64%  stress-ng-cpu    libgcc_s.so.1                    [.] __multf3
   2.52%  stress-ng-cpu    libm.so.6                        [.] __multf3
   1.70%  stress-ng-cpu    libgcc_s.so.1                    [.] __addtf3
   1.53%  glmark2-es2-way  libc.so.6                        [.] memmove
   1.17%  swapper          [kernel.kallsyms]                [k] finish_task_swit
   0.79%  stress-ng-cpu    libm.so.6                        [.] __addtf3
   0.74%  gnome-system-mo  libpixman-1.so.0.42.2            [.] 0x000000000002c4
   0.66%  stress-ng-cpu    libm.so.6                        [.] __subtf3
   0.57%  glmark2-es2-way  glmark2-es2-wayland              [.] WaveMesh::update
   0.52%  fio              [kernel.kallsyms]                [k] finish_task_swit
   0.42%  gnome-shell      libc.so.6                        [.] memcpy
   0.38%  mpv              [kernel.kallsyms]                [k] arch_sync_dma_fo
   0.30%  stress-ng-cpu    libm.so.6                        [.] __sqrtl_finite@G
   0.29%  stress-ng-cpu    libgcc_s.so.1                    [.] __divtf3
   0.26%  mpv/vo           [kernel.kallsyms]                [k] arch_sync_dma_fo
   0.24%  fio              fio                              [.] get_io_u
   0.23%  gnome-system-mo  libcairo.so.2.11800.0            [.] 0x000000000002de
   0.23%  chrome           libc.so.6                        [.] memcpy
   0.23%  ThreadPoolForeg  chrome                           [.] 0x0000000005457b
   0.23%  chrome           [kernel.kallsyms]                [k] finish_task_swit
bpftrace vs perf
| Feature | bpftrace | perf |
|---|---|---|
| Data Collection | Event-driven | Sampling-based |
| Programming Capability | Supports complex scripting | Limited customization |
| Analysis Depth | Can inspect internal function logic | Mainly focuses on call frequency |
| Visualization | Built-in histograms and other statistics | Relies on external tools for flame graphs |
Common Filesystem Exceptions
Filesystem Becomes Read-Only
This is the most common protective exception.
Symptoms: Unable to create new files or modify/delete existing files, with system messages such as Read-only file system.
Troubleshooting Steps
-
Check for unexpected power loss before the current boot
- If there was an unexpected power loss, manually run the appropriate filesystem repair tool to scan and repair the filesystem, ensuring metadata consistency.
- This issue is especially common for hot-pluggable devices such as SD cards or USB drives.
-
Check for memory or storage device errors
- Use
dmesgto check system logs for storage driver errors in addition to filesystem read/write errors.
- Use
Solutions
-
Manually Repair the Filesystem Using
fsckBasic command syntax:
sudo fsck [options] <device_name>Common Options:
-p: Automatically repair all safe-to-fix errors without prompting. This is one of the default behaviors but may not fix all issues.-y/--yes: Automatically answer "yes" to all prompts. This is the most commonly used option for forced repair.-n: Check the filesystem without making any repairs.-f: Force a check even if the filesystem appears clean.-v: Verbose mode; displays detailed process information.-C: Show a progress bar (valid only for ext2/3/4 filesystems).
-
Address Storage Driver Errors
If system logs show storage driver errors such as
mmc0,mmc2,usb, etc.:- Consult the corresponding driver documentation and FAQs to see if there is a suggested solution for similar issues.
- For SD cards or USB external storage devices, consider replacing the device to check if it is a hardware fault.
Mount Failures
Specified IO Character Set Not Found
Example of the error message:
mount -t vfat /dev/block/vol-179-33 /mnt/data/external/8461-3631                         <
[  562.455742] FAT-fs (mmcblk0p1): IO charset iso8859-1 not found
Solutions
Step 1: Check if the corresponding character set is configured
zcat /proc/config.gz | grep CONFIG_NLS_ISO8859_1
Step 2: Configure the corresponding character set in the kernel menuconfig
-> File systems
    -> Native language support (NLS [=y])
        -> NLS ISO 8859-1 (Latin 1; Western European Languages)(NLS_IS08859_1 [=y])
Disk Full (No Space Left on Device)
Symptom: Unable to write files
System error: No space left on device
Possible causes:
- Disk blocks exhausted:
- Use
df -hto check if a partition's usage is 100%.
- Use
- Inodes exhausted:
- The disk may still have free space, but the Inode table (storing file metadata such as names, permissions, timestamps) is full.
- Common in systems with a large number of small files (e.g., mail, cache files).
- Check inode usage with
df -i.
Boot or Other Aging Scenarios: Oops
Oops Illegal Instruction
[  135.238092] Oops - illegal instruction [#1]
[  135.238110] Modules linked in: husb239 typec 8852bs
[  135.238127] CPU: 3 PID: 2787 Comm: distribute#1 Not tainted 6.6.36 #1
[  135.238137] Hardware name: M1-MUSE-PAPER2 (DT)
[  135.238142] epc : close_fd_get_file+0x2/0x46
[  135.238162]  ra : __riscv_sys_close+0x10/0x60
[  135.238171] epc : ffffffff8024759a ra : ffffffff80224a84 sp : ffffffc80a05bea0
[  135.238176]  gp : ffffffff82302708 tp : ffffffd961e0b300 t0 : ffffffff80ffc052
[  135.238180]  t1 : ffffffff816011b0 t2 : ffffffff81601230 s0 : ffffffc80a05bec0
[  135.238185]  s1 : ffffffc80a05bf30 a0 : 0000000000000024 a1 : 0000000000000000
[  135.238188]  a2 : 0000000000000000 a3 : 0000000300000000 a4 : 0000000200000000
[  135.238191]  a5 : ffffffff80224a74 a6 : 0000003f8947f2d4 a7 : 0000000000000039
[  135.238196]  s2 : 0000003f8a2e2c70 s3 : 0000000000000000 s4 : 0000000000000008
[  135.238199]  s5 : 0000003f8947faf8 s6 : 0000000000000000 s7 : 0000000100000000
[  135.238202]  s8 : ffffffffffffffff s9 : 0000003f8978a010 s10: 7fffffffffffffff
[  135.238205]  s11: 8000000000000000 t3 : 0000003f8a2e2da8 t4 : 0000000000000010
[  135.238208]  t5 : 000000000147ae14 t6 : ffffffffffff7fff
[  135.238211] status: 0000000200000120 badaddr: 000000000904ff07 cause: 0000000000000002
[  135.238216] [<ffffffff8024759a>] close_fd_get_file+0x2/0x46
[  135.238225] [<ffffffff80ffc10c>] do_trap_ecall_u+0xba/0x12e
[  135.238238] [<ffffffff81005582>] ret_from_exception+0x0/0x6e
[  135.238251] Code: ff05 0a04 ff05 0a04 ff05 0904 ff07 0904 ff07 0904 (ff07) 0904
[  135.238259] ---[ end trace 0000000000000000 ]---
[  135.238263] Kernel panic - not syncing: Fatal exception in interrupt
[  135.238266] SMP: stopping secondary CPUs
[  135.392375] ---[ end Kernel panic - not syncing: Fatal exception in interrupt ]---
The above illegal instruction occurs at the Linux kernel level and may manifest as random anomalies, with different stack traces appearing on multiple reboots.
Troubleshooting Steps
-
Check DDR capacity configuration
- For brand-new boards, ensure the DDR size used on the board matches the size reported during boot.
- If sizes differ, re-flash the CS value using the flashing tool to ensure the DDR is correctly configured.
-
Verify DDR stability (especially for new boards)
- Stress test the DDR using
memtestto rule out stability issues. - SpacemiT provides a closed-source bare-metal DDR test tool; contact AE if needed.
- Stress test the DDR using
-
Check Image integrity (especially after upgrade or manual flashing)
- Confirm that a manual installation was followed by a proper reboot.
- Sudden power-off or using
reboot -fmay cause data in the filesystem cache not to be safely written to main memory.
-
Confirm U-Boot loading Image address
- For example, logs may show the Image loaded at physical addresses
0x600000~0x2786000. - It is recommended to enable
memblock=debugin the boot cmdline to check for conflicts with reserved kernel memory.
- For example, logs may show the Image loaded at physical addresses
No FDT memory address configured. Please configure
the FDT address via "fdt addr <address>" command.
Aborting!
[   1.719] Moving Image from 0x200000 to 0x600000, end=2786000
[   1.740] ## Flattened Device Tree blob at 31000000
[   1.741]    Booting using the fdt blob at 0x31000000
[   1.746]    Loading Ramdisk to 7d8b8000, end 7dd7dee7 ... OK
[   1.759]    Loading Device Tree to 000000007d89f000, end 000000007d8b793f ... OK
There are three common ways to enable memblock debug information:
- Modify the
bootfspartition'senv_k1-x.txt, addmemblock=debug, and reboot. - Enter the
U-Bootshell and useenv setto updatebootargs, addingmemblock=debug. - Modify the kernel
dtsifile, addingmemblock=debugtobootargs; this method requires recompiling the kernel.
Solutions
-
DDR Capacity Misconfiguration
- Use the flashing tool to rewrite the CS values to ensure correct capacity recognition.
- The flashing tool is integrated into the firmware update tool, see: Tool Link
-
DDR Stability Issues (memtest Fails)
- Verify that the DDR is listed in the official SpacemiT supported list.
- If not, use DDR modules from the supported list, or provide the DDR model to SpacemiT to include it after stress testing.
- Supported DDR list: DDR Support List
-
Unexpected Reboot After Update
- Modify
envin U-Boot shell to select the previous Image version. - After booting normally, reinstall deb packages or perform the upgrade, then run
syncto ensure data is written to disk. - Finally, run
rebootto let the new Image take effect properly.
- Modify
-
Image Loading Address Issues
- Use
memblock debugto identify address conflicts. - Resolve conflicts by adjusting the Image loading address:
- Bianbu OS loads Images in non-FIT format, so use Linux
menuconfigto adjustCONFIG_IMAGE_LOAD_OFFSET.
- Bianbu OS loads Images in non-FIT format, so use Linux
- Use
Symbol: IMAGE_LOAD_OFFSET [=0x600000]
  │ Type  : hex
  │ Defined at arch/riscv/Kconfig:1072
  │   Prompt: Image load offset from start of RAM when load kernel to RAM
  │Location:
  │ (1) -> Image load offset from start of RAM when load kernel to RAM (IMAGE_LOAD_OFFSET [=0x600000])
Oops Address Issues
Unable to handle kernel paging request at virtual address ffffffdb33e98040
[   87.422523] systemd-journal[382]: unhandled signal 4 code 0x1 at 0x0000003f9c21ec1e in libsystemd-shared-255.so[3f9c000000+33b000]
[   87.422561] CPU: 6 PID: 382 Comm: systemd-journal Not tainted 6.6.63 #2.2~beta1.2+20250325010730
[   87.422568] Hardware name: spacemit k1-x MUSE-Pi-Pro board (DT)
[   87.422572] epc : 0000003f9c21ec1e ra : 0000003f9c2089ce sp : 0000003fe8845980
[   87.422576]  gp : 0000002abe00e800 tp : 0000003f9bbce780 t0 : 000000003d454741
[   87.422580]  t1 : 0000003f9c06d9dc t2 : 4f4e4f4d5f454352 s0 : 0000003fe8845ab0
[   87.422584]  s1 : 000000000000000a a0 : 0000003fe8845a18 a1 : 0000003f9bbcf100
[   87.422587]  a2 : 0000000000000001 a3 : ffffffffffffffff a4 : fffffffffffff8d0
[   87.422590]  a5 : 6515380c376e55a9 a6 : 0000003f9c453000 a7 : 0000000000000000
[   87.422594]  s2 : 0000003fe8845af0 s3 : 0000003fe8845a28 s4 : 0000000000000000
[   87.422598]  s5 : 0000002abe017280 s6 : 0000003fe8845a18 s7 : 0000003f9c47dd08
[   87.422602]  s8 : 000000000534c50e s9 : 0000003fe8845a28 s10: 0000003fe8845c20
[   87.422605]  s11: 0000000000000000 t3 : 0000003f9c466aa8 t4 : ffffffffffffffff
[   87.422609]  t5 : 000000009aa8aa71 t6 : 0000003fe8847ad0
[   87.422612] status: 0000000200004020 badaddr: 0000000000000000 cause: 0000000000000002
[   87.423783] apport[2790]: unhandled signal 4 code 0x1 at 0x0000003fb82236d2 in ld-linux-riscv64-lp64d.so.1[3fb820f000+22000]
[   87.423827] CPU: 4 PID: 2790 Comm: apport Not tainted 6.6.63 #2.2~beta1.2+20250325010730
[   87.423834] Hardware name: spacemit k1-x MUSE-Pi-Pro board (DT)
[   87.423838] epc : 0000003fb82236d2 ra : 0000003fb821f9f8 sp : 0000003fc88dbc00
[   87.423843]  gp : 0000000000000000 tp : 0000000000000000 t0 : 0000000000000000
[   87.423847]  t1 : 0000003fb820d000 t2 : 0000000000000000 s0 : 0000003fc88dbc50
[   87.423852]  s1 : 0000003fb8220c10 a0 : 0000000000000000 a1 : 0000003fc88dbbec
[   87.423855]  a2 : 0000000000000000 a3 : 0000003fb8232228 a4 : 0000003fb8232ae0
[   87.423859]  a5 : 0000000000000001 a6 : 0000000000000000 a7 : 0000000000000002
[   87.423863]  s2 : 0000003fb8232d10 s3 : 0000003fb8232cd8 s4 : 0000003fb820f000
[   87.423867]  s5 : 0000000000000005 s6 : 0000000000000002 s7 : 0000003fb820f000
[   87.423872]  s8 : 0000003fb8234008 s9 : 0000000000000000 s10: 0000003fb820f388
[   87.423876]  s11: 0000000000000003 t3 : 0000000000000440 t4 : 0000000000000000
[   87.423880]  t5 : 0000000000000064 t6 : 0000000000000000
[   87.423883] status: 0000000200004020 badaddr: 0000000000000000 cause: 0000000000000002
Troubleshooting Steps
-
Check DDR Capacity Configuration
- For a brand-new board, verify that the DDR capacity matches what is reported during boot.
- If there is a mismatch, use the flashing tool to rewrite the CS value to ensure correct DDR configuration.
-
Verify DDR Stability (especially for new boards)
- Run
memtestto stress-test the DDR and rule out stability issues. - SpacemiT provides a closed-source bare-metal DDR testing tool; contact your AE if needed.
- Run
-
Confirm if It Is a Native Kernel Code Issue
- If the crash stack originates from native kernel code, enable kernel memory debugging and use KASAN (Kernel Address Sanitizer) to detect potential illegal memory access.
- If driver errors are detected, collect and provide the logs to SpacemiT for further analysis.
Solutions
-
DDR Capacity Misconfiguration
- Rewrite the CS value using the flashing tool to ensure correct DDR capacity recognition.
- The flashing tool is integrated into the firmware flashing toolset. See: Tool Link
-
DDR Stability Issues (memtest Failures)
- Check whether the DDR module is listed in the official SpacemiT supported list.
- If not, either use DDR modules from the supported list or provide the DDR model to SpacemiT for stress testing and possible inclusion in the support list.
- Supported DDR list: DDR Supported List
-
Enable KASAN for Memory Issue Detection
- Enable KASAN by setting
KASAN=Yand then compile and run the kernel to detect runtime memory errors.
- Enable KASAN by setting
Symbol: KASAN [=n]
  │ Type  : bool
  │ Defined at lib/Kconfig.kasan:34
  │   Prompt: KASAN: dynamic memory safety error detector
  │   Depends on: ((HAVE_ARCH_KASAN [=y] && CC_HAS_KASAN_GENERIC [=y] || HAVE_ARCH_KASAN_SW_TAGS [=n] && CC_HAS_KASAN_SW_TAGS [=n]) && CC_HAS_WORKING_NOSANITIZ
  │   Location:
  │     -> Kernel hacking
  │       -> Memory Debugging
  │ (1)     -> KASAN: dynamic memory safety error detector (KASAN [=n])
  │ Selects: STACKDEPOT_ALWAYS_INIT [=n]
If exceptions such as BUG: KASAN: global-out-of-bounds are detected, attach the log and submit a ticket to SpacemiT for investigation.
Note: KASAN significantly affects performance and should be enabled only in debug scenarios. For other use cases, keep it disabled.
SWIOTLB Full Causing Issues in Certain Scenarios
When a memory address exceeds the device-accessible range (e.g., USB or storage modules), and the hardware IP cannot directly access that address, SWIOTLB is used to copy the data once. This process can impact performance. SpacemiT reserves 128 MB for SWIOTLB.
SWIOTLB full exception log example:
spacemit-k1xvi c0230000.vi: swiotlb buffer is full (sz: 1048576 bytes), total 65536 (slots), used 498 (slots)
Troubleshooting Steps
Use trace event to check which devices or processes are using SWIOTLB.
Step 1: Mount tracefs
sudo mount -t debugfs none /sys/kernel/debug
Step 2: Enable SWIOTLB trace events
cd /sys/kernel/tracing/
echo 1 > events/swiotlb/enable
Note: This trace event supports filtering.
Step 3: View trace logs
cat trace
Example output:
disp_eng_share_-1439    [000] .....   197.644246: swiotlb_bounced: dev_name: d4280800.sdh dma_mask=ffffffff dev_addr=ffffffffffffffff size=4 NORMAL
disp_eng_share_-1439    [000] .....   197.644264: swiotlb_bounced: dev_name: d4280800.sdh dma_mask=ffffffff dev_addr=ffffffffffffffff size=4 NORMAL
jbd2/mmcblk2p6--289     [006] .....   197.926040: swiotlb_bounced: dev_name: d4281000.sdh dma_mask=ffffffff dev_addr=ffffffffffffffff size=4096 NORMAL
jbd2/mmcblk2p6--289     [006] .....   197.926052: swiotlb_bounced: dev_name: d4281000.sdh dma_mask=ffffffff dev_addr=ffffffffffffffff size=4096 NORMAL
jbd2/mmcblk2p6--289     [006] .....   197.926055: swiotlb_bounced: dev_name: d4281000.sdh dma_mask=ffffffff dev_addr=ffffffffffffffff size=4096 NORMAL
jbd2/mmcblk2p6--289     [006] .....   197.926059: swiotlb_bounced: dev_name: d4281000.sdh dma_mask=ffffffff dev_addr=ffffffffffffffff size=4096 NORMAL
kworker/6:1H-76      [006] .....   197.930374: swiotlb_bounced: dev_name: d4281000.sdh dma_mask=ffffffff dev_addr=ffffffffffffffff size=4096 NORMAL
ksdioirqd/mmc1-1416    [005] .....   199.158983: swiotlb_bounced: dev_name: d4280800.sdh dma_mask=ffffffff dev_addr=ffffffffffffffff size=4 NORMAL
ksdioirqd/mmc1-1416    [005] .....   199.159042: swiotlb_bounced: dev_name: d4280800.sdh dma_mask=ffffffff dev_addr=ffffffffffffffff size=4 NORMAL
ksdioirqd/mmc1-1416    [005] .....   199.159071: swiotlb_bounced: dev_name: d4280800.sdh dma_mask=ffffffff dev_addr=ffffffffffffffff size=212 NORMAL
ksdioirqd/mmc1-1416    [005] .....   199.159111: swiotlb_bounced: dev_name: d4280800.sdh dma_mask=ffffffff dev_addr=ffffffffffffffff size=4 NORMAL
disp_eng_share_-1439    [000] .....   199.653920: swiotlb_bounced: dev_name: d4280800.sdh dma_mask=ffffffff dev_addr=ffffffffffffffff size=4 NORMAL
These trace events allow dynamic monitoring of SWIOTLB usage, including which device or process is using it and how much memory is consumed.
Solutions
Check the driver’s DMA mask configuration
- If a driver does not explicitly call
coherent_dma_mask()ordma_set_mask_and_coherent(), the system defaults to a 32-bit configuration. - If the driver transfers data with other modules and the required DMA address exceeds the driver’s capability, SWIOTLB will copy the data once, consuming the reserved 128 MB of SWIOTLB memory.
For example, the driver can add the following configuration:
+  ret = dma_set_mask_and_coherent(&pdev->dev, DMA_BIT_MASK(33));
+  if (ret)
+      return ret;